
Neural Circuit Visualizer


Version 1.0, July 2025
NCV (Neural Circuit Visualizer) is a web-based platform designed for the flexible simulation and visualization of full-scale point-neuron circuits . It provides researchers and educators with an intuitive interface to build, configure, and explore large-scale neural networks in a virtual environment
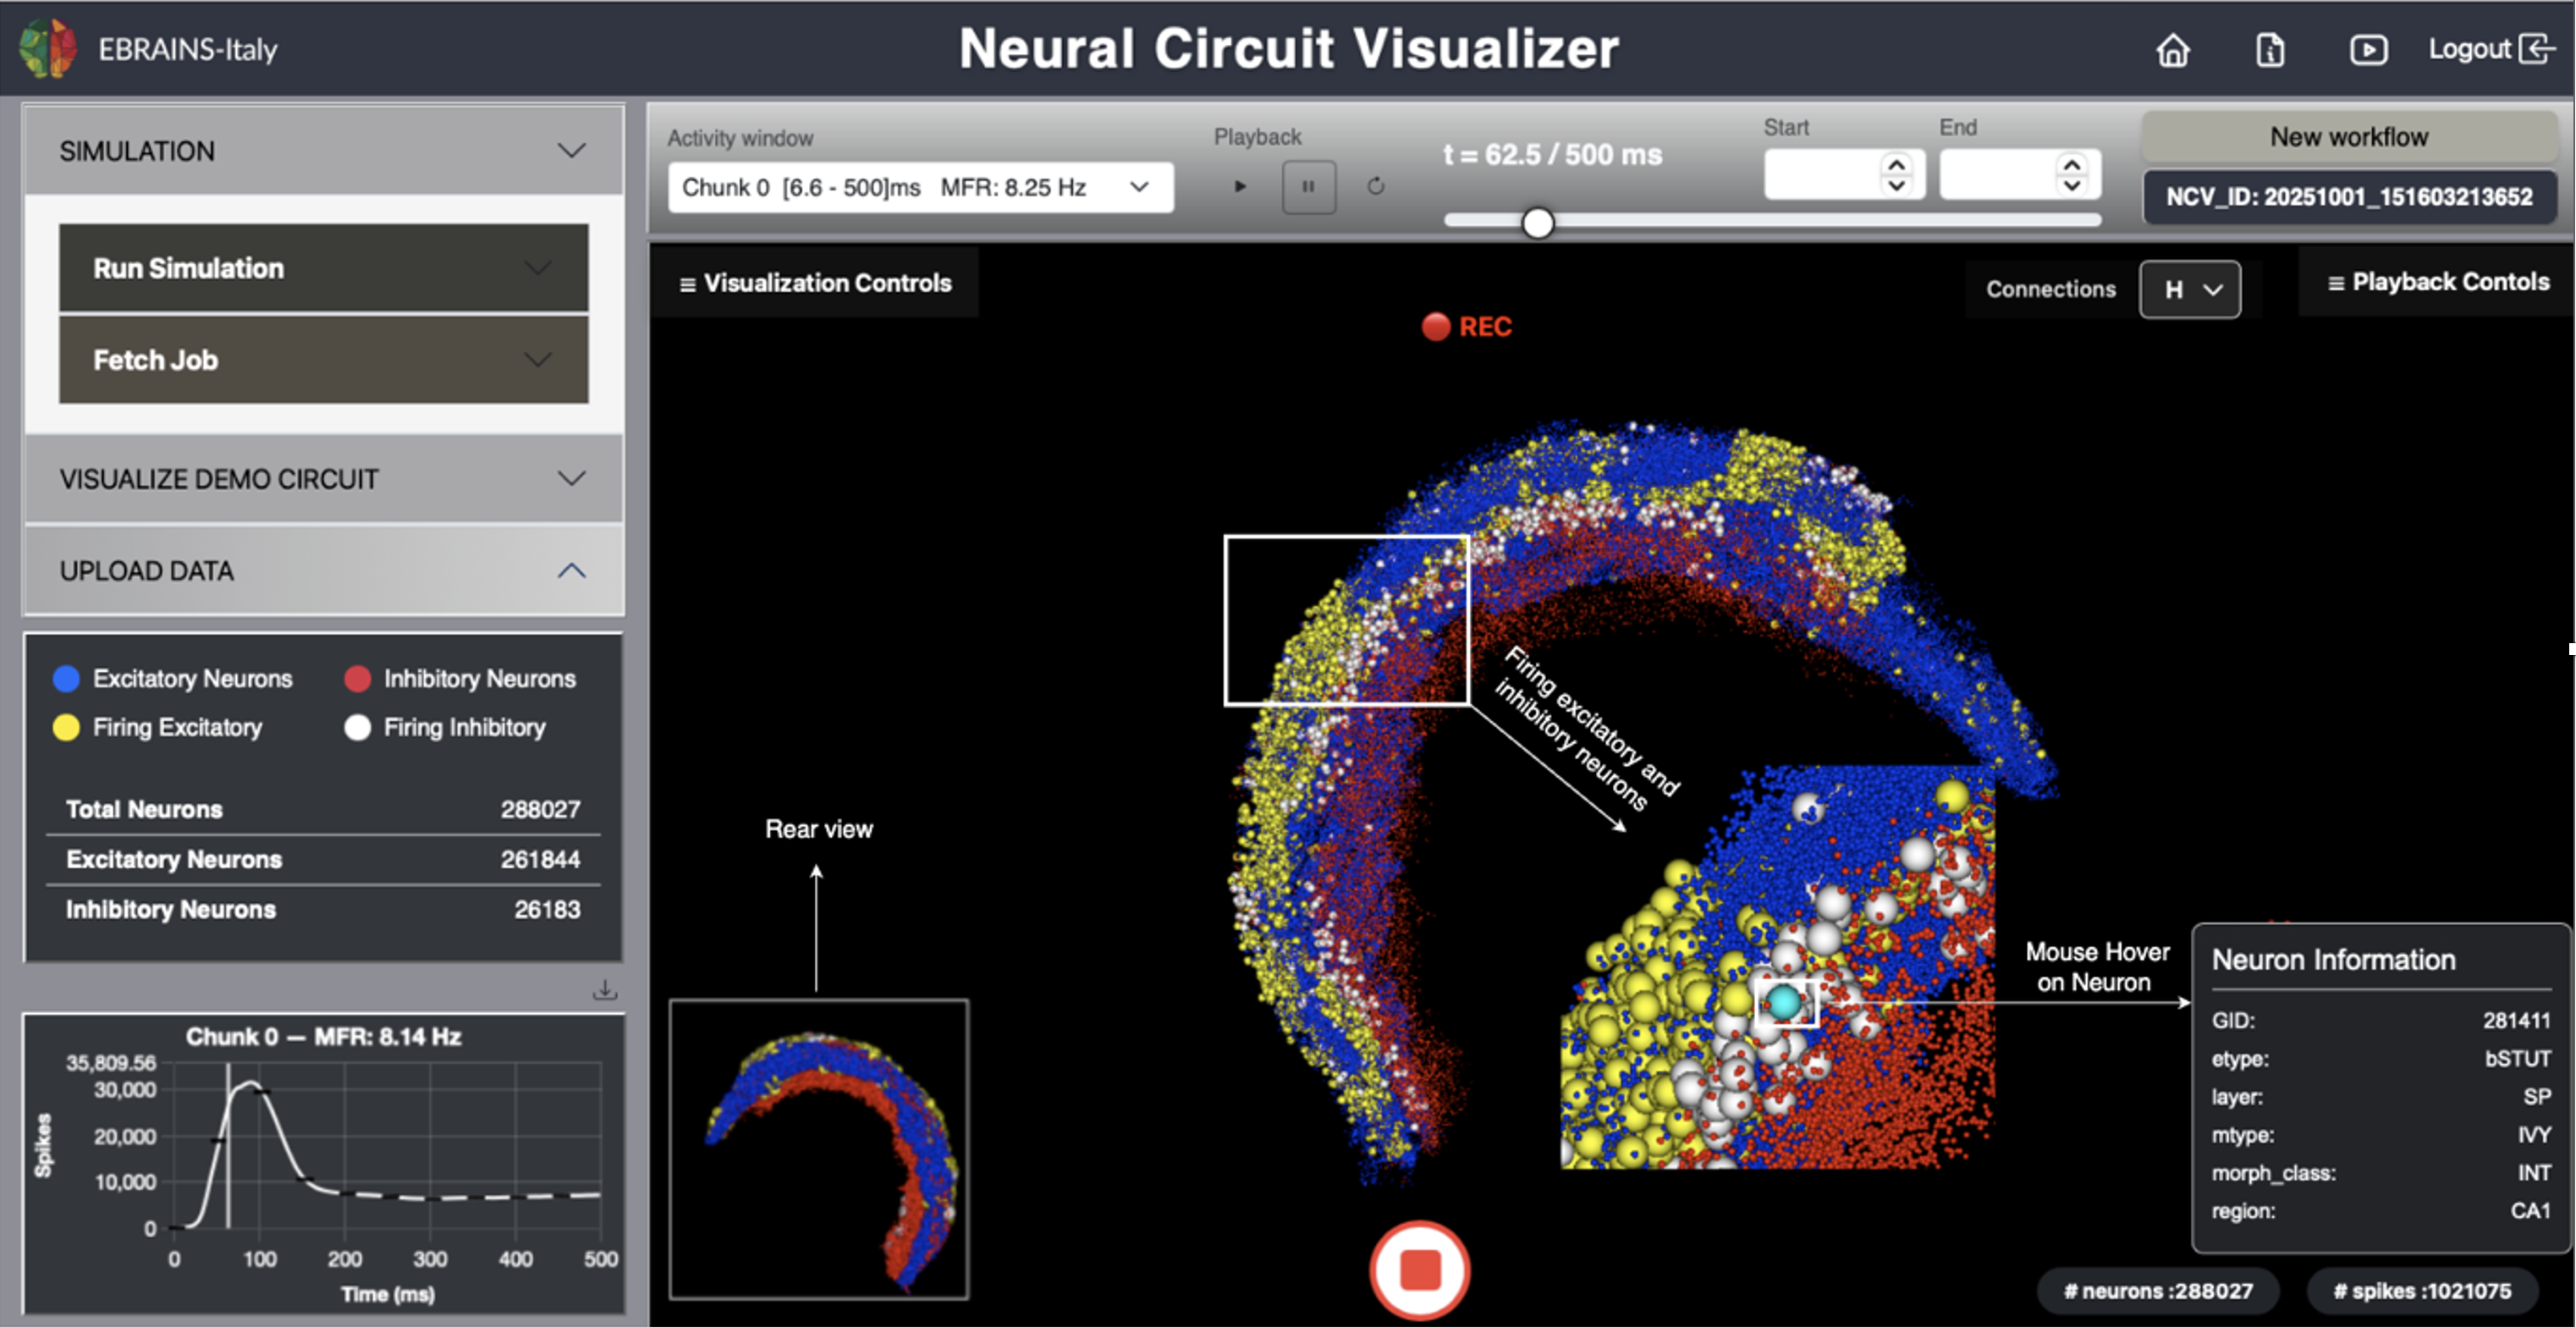
Fig. 1 The NCV graphical user interface.
NCV’s goal is to make computational neuroscience more accessible by integrating simulation, visualization, and data exploration into a single, web-based ecosystem.
The Run Simulation panel allows users to configure and launch neural circuit simulations directly through the NCV interface. It provides flexible control over model parameters and access to supported high-performance computing (HPC) platforms. Simulations are based on a mouse CA1 hippocampal network from Gandolfi et al., 2022
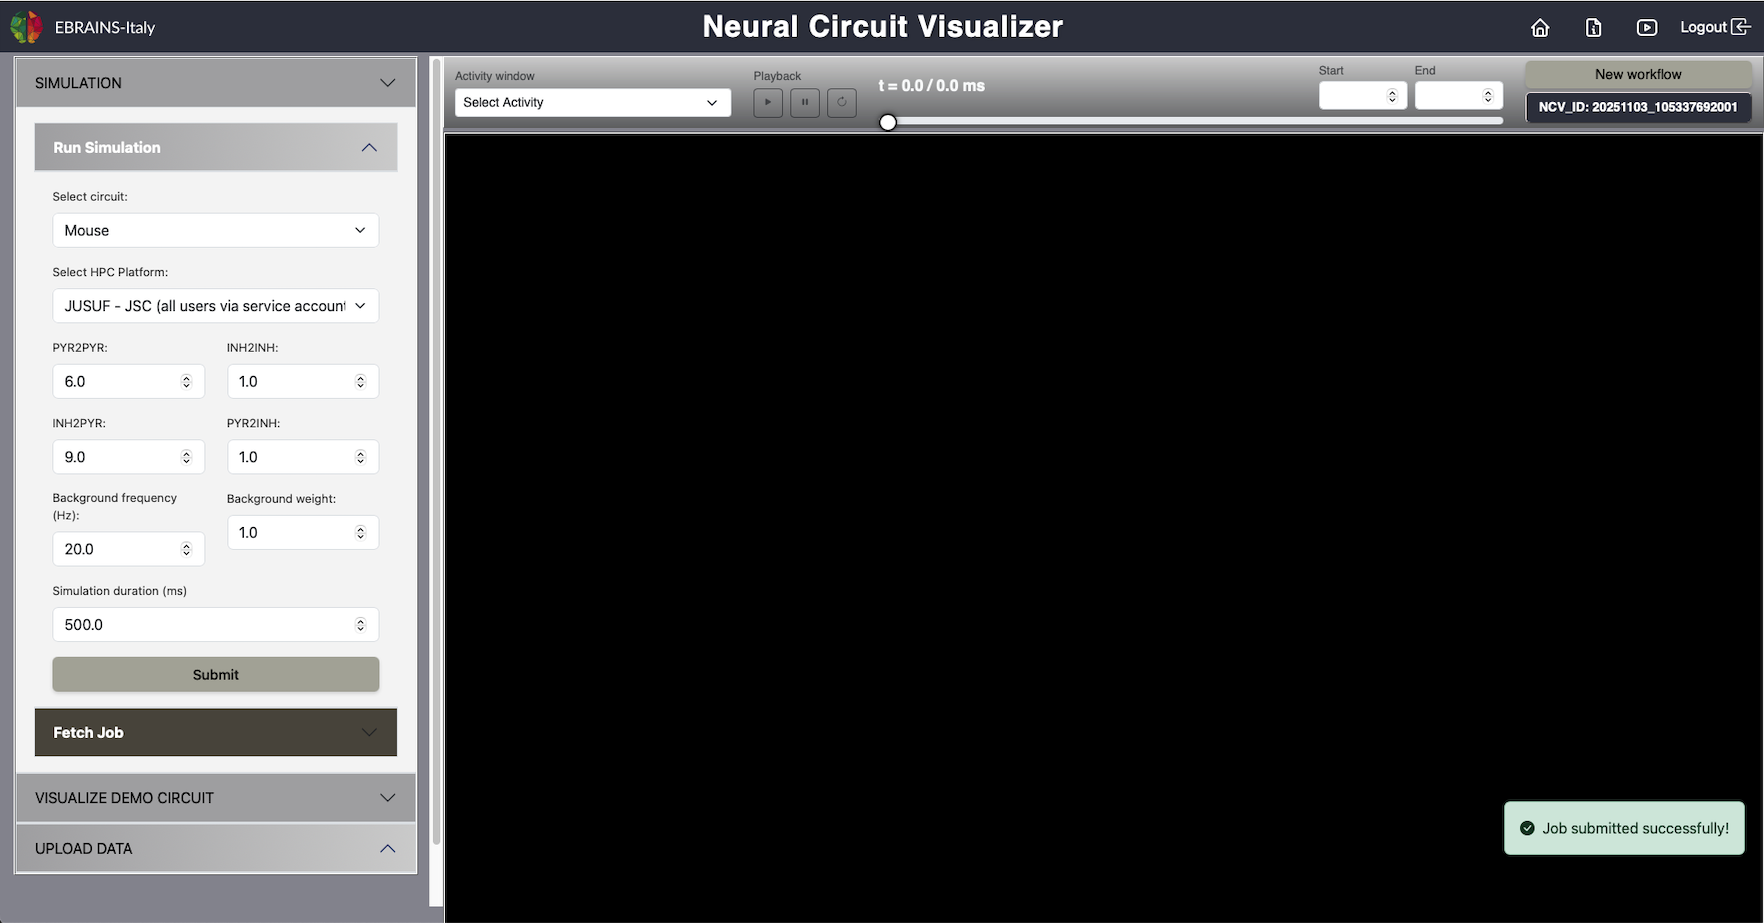
Fig. 2 Run Simulation.
The model simulation workflow includes the following steps: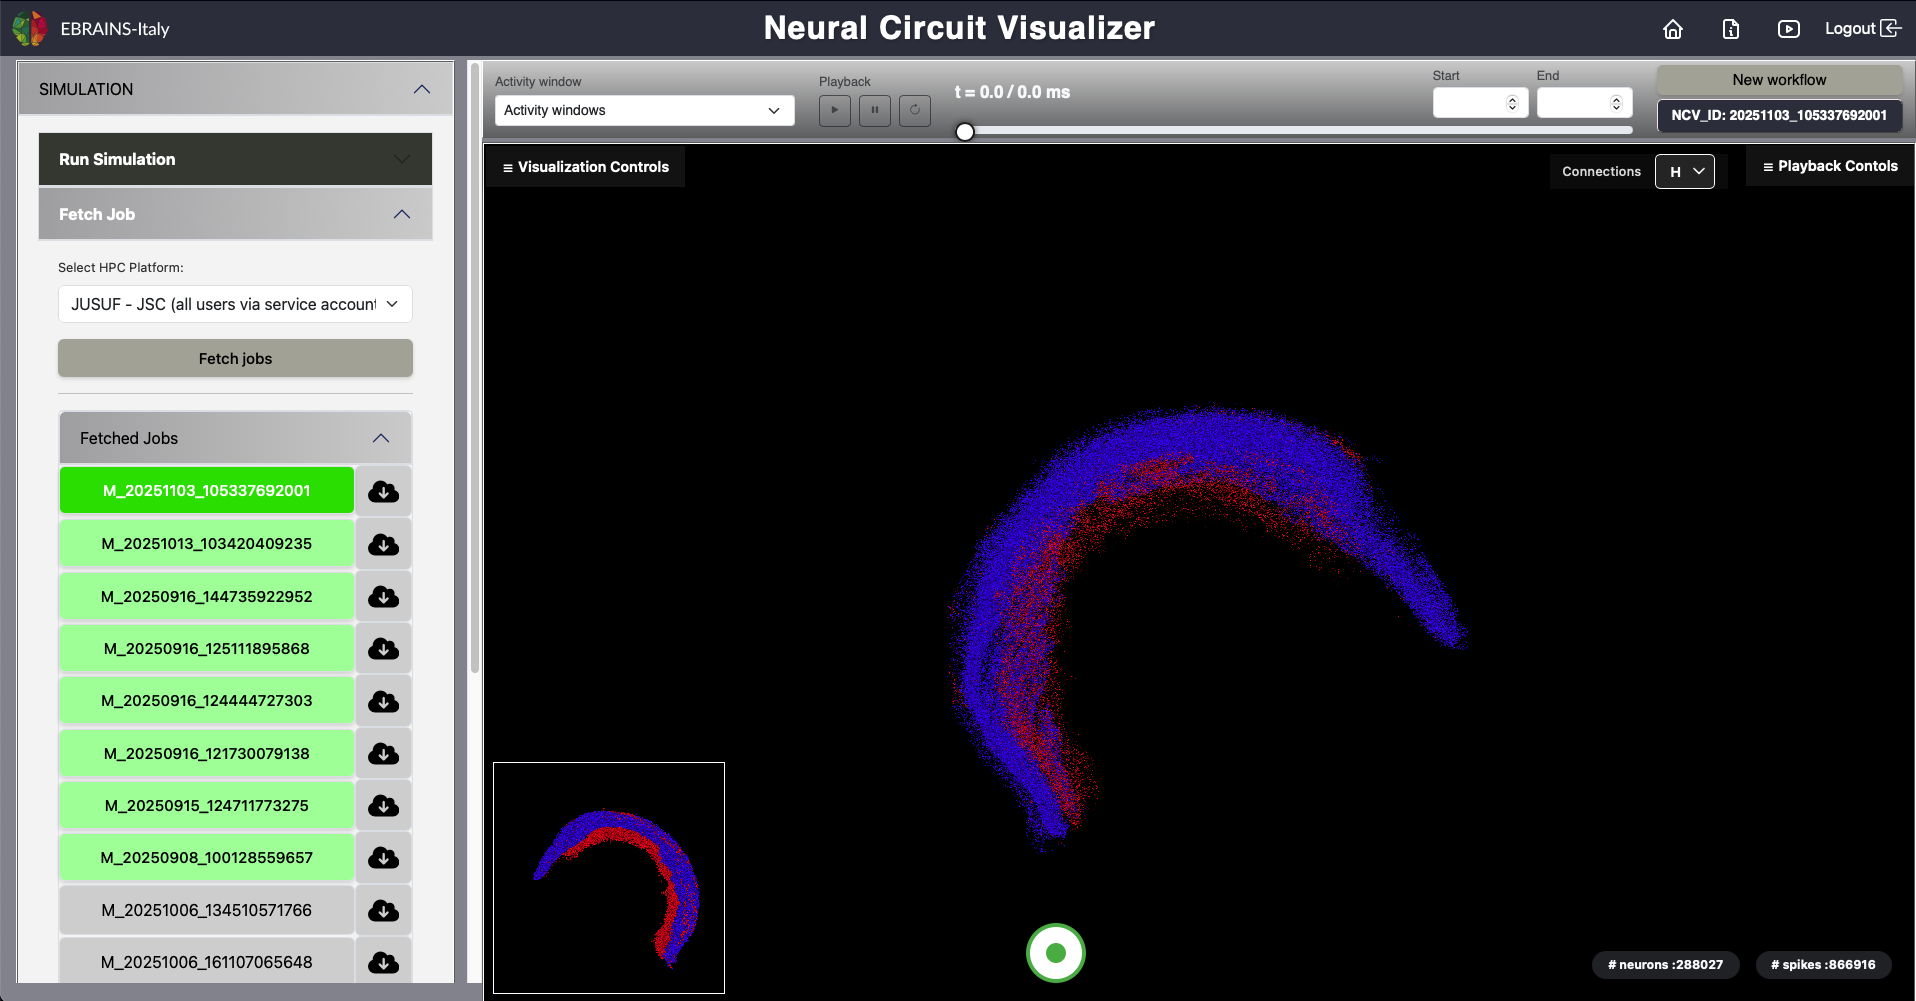
Fig. 3 Fetch Simulation Results.
After a simulation has been submitted, users can retrieve and visualize completed job results through the following steps:
In order to manage large files at the frontend level and provide a flawless visualization experience to the users, the raw data files are divided into chunks of 200 MB.
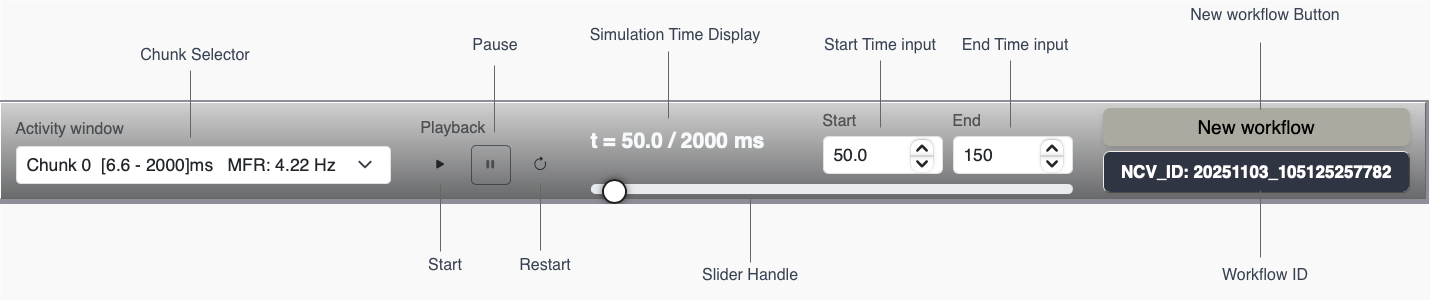
Fig. 4 Simulation, Playback and Rendering Controls.
It comprises the following:t
and total duration (in milliseconds)
Workflow ID
that will be used for job submission on the HPC systems
The Visualization Controls Panel provides interactive controls to adjust visual and spatial aspects of the neural circuit display in the NCV environment. It allows users to fine-tune how neurons and the 3D scene are rendered for analysis and presentation.
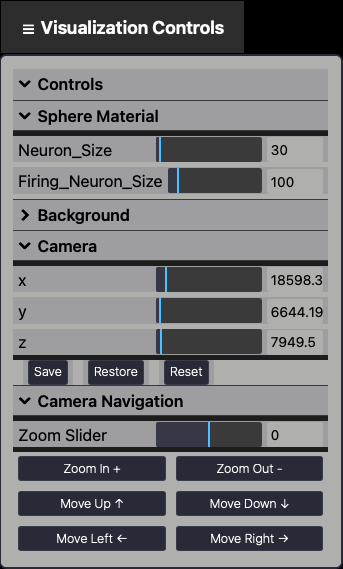
Fig. 5 Visualization Panel.
It includes:x
,
y
, and
z
sliders. Each axis includes a numeric field for precise manual adjustments.
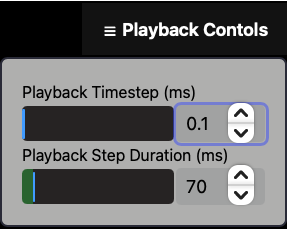
Fig. 6 Playback Controls Panel.
The
Recording
button allows users to capture a live recording of the 3D neural activity visualization within NCV.
The rear camera view, the simulation time and all the actions performed by the users during the visualization (e.g., zooming, rotating, translating) will also be recorded.
This feature is designed to generate video output for analysis, sharing, and presentation of simulation results.
To start and stop the recording, the central button at the bottom of the main panel must be pressed (see Fig. 1). Once the recording is stopped, a .webm file is automatically downloaded.
Saved movies can be replayed using any standard media player to review the simulation dynamics frame by frame.
If you do not have your own network and activity files yet, you can explore the platform by loading one of the provided Demo Circuits
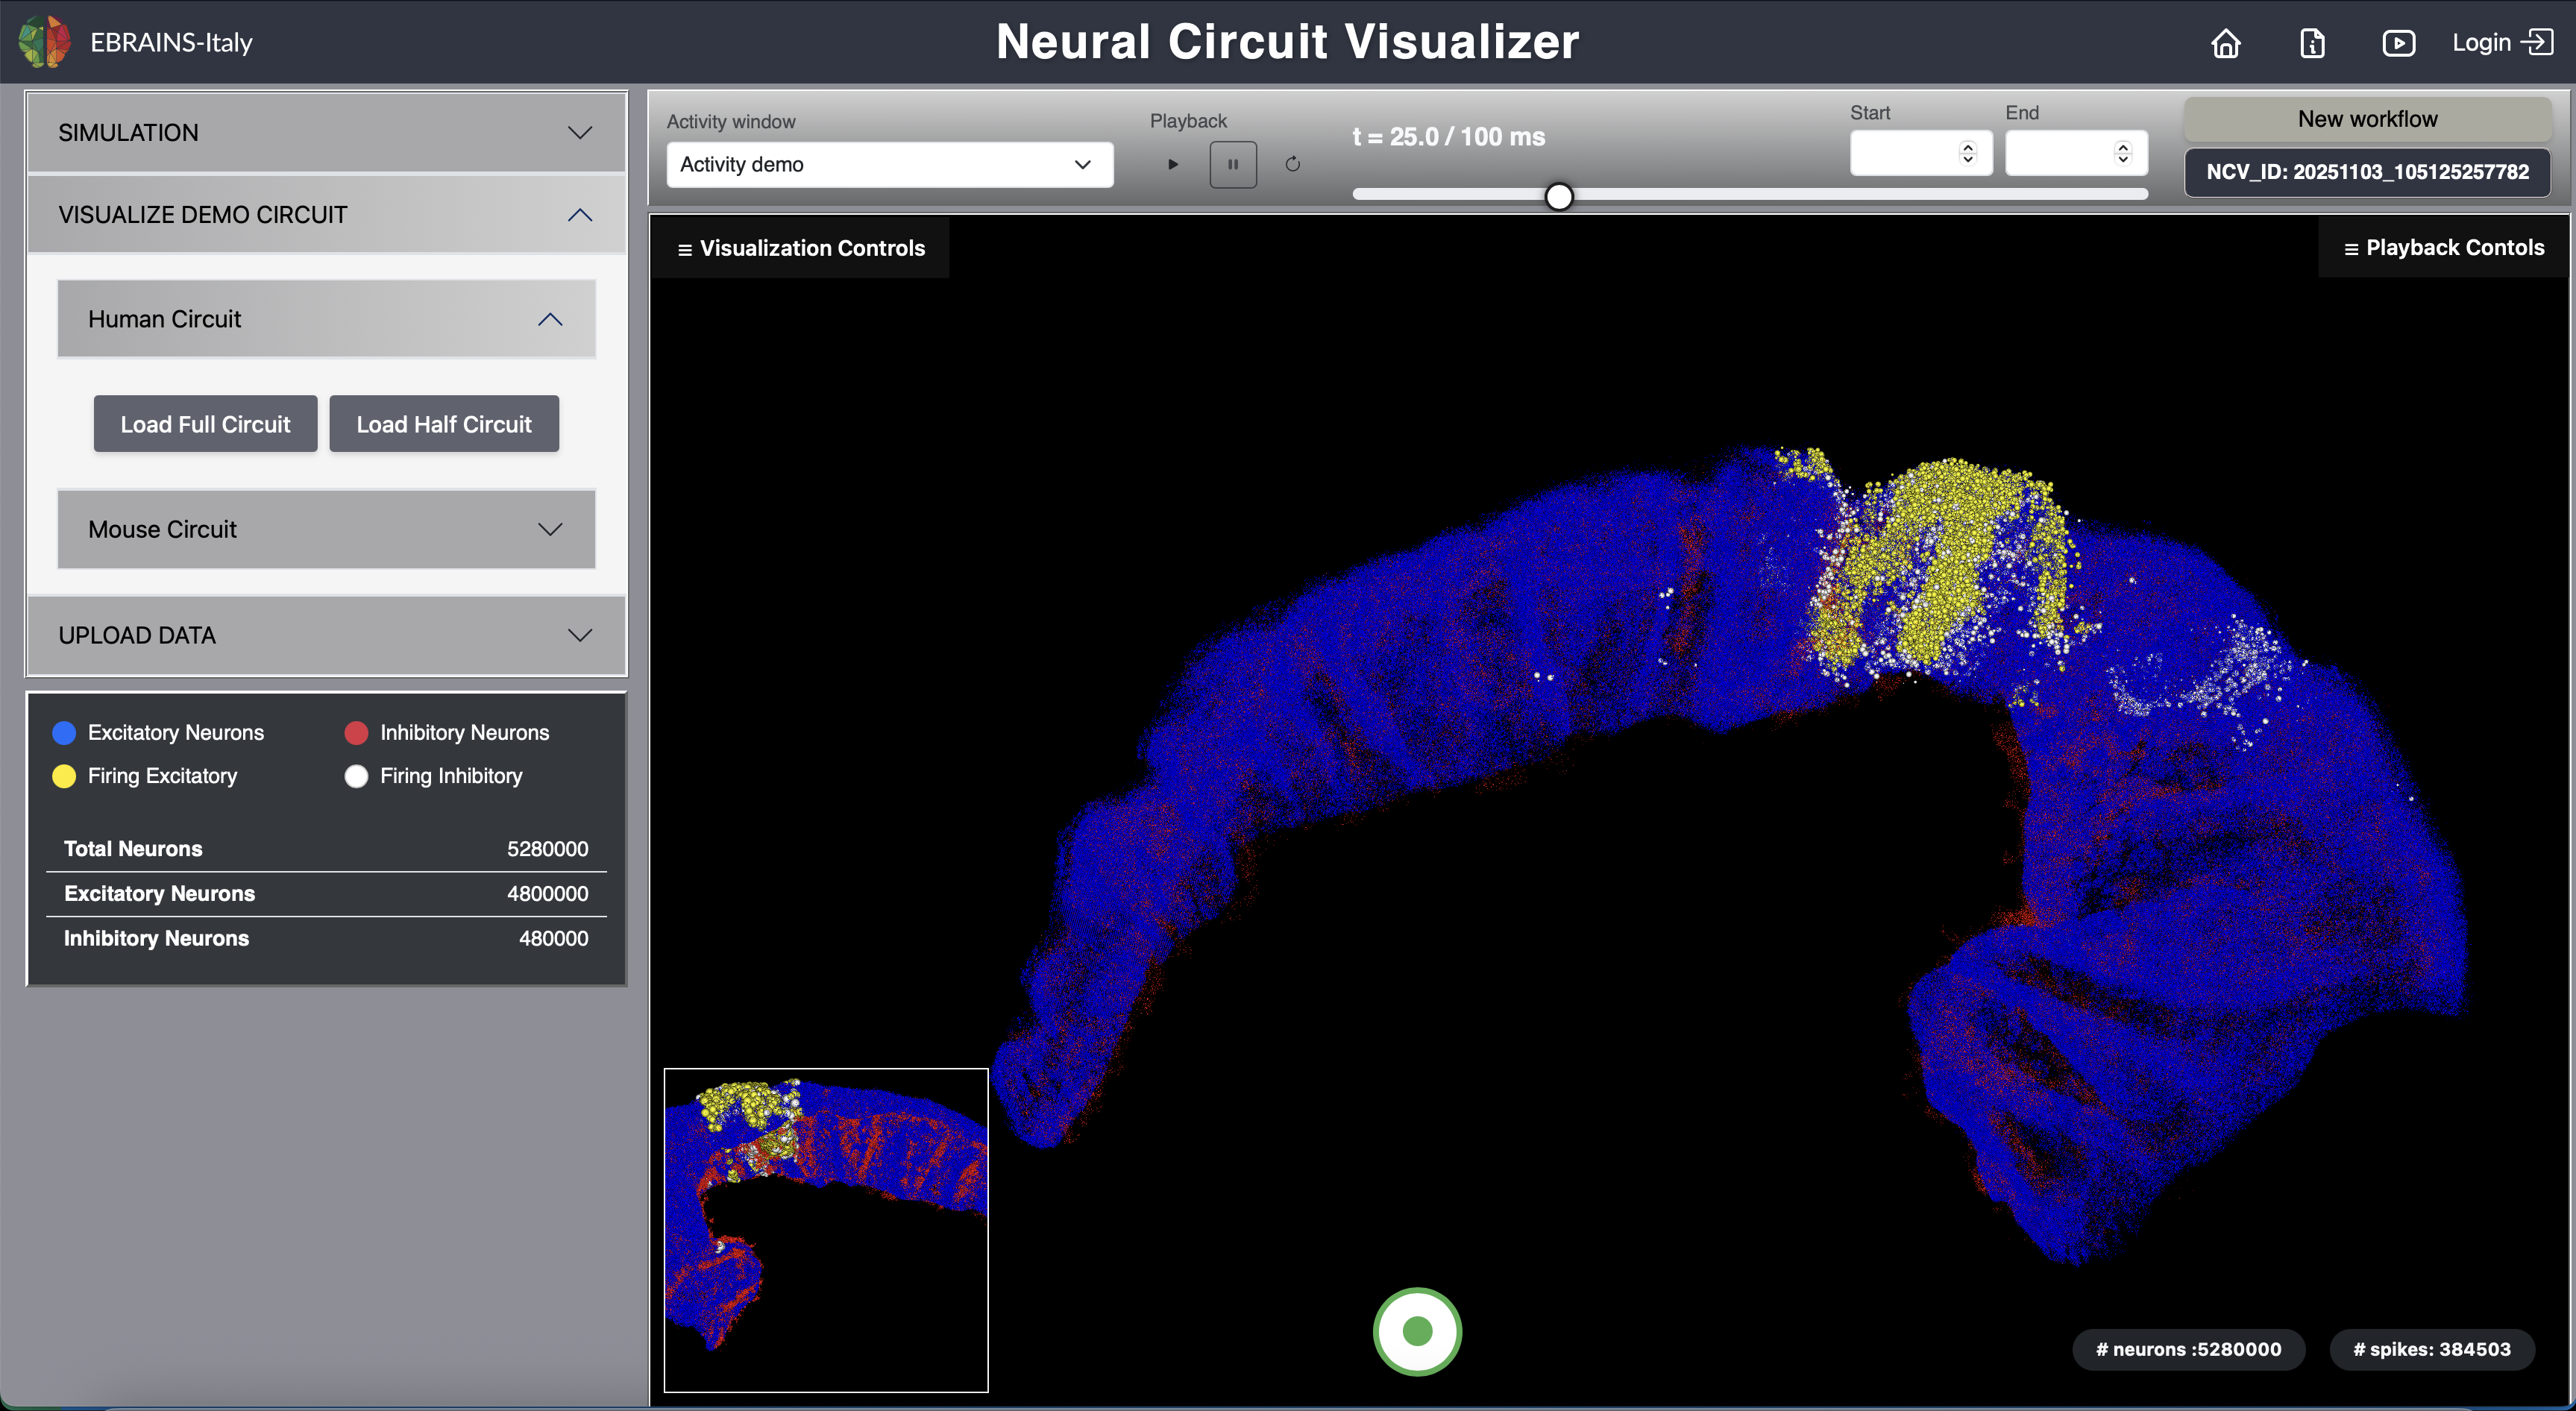
Fig. 7 Full Human CA1 Circuit.
The Mouse Circuit provides an advanced demo mode, allowing users to selectively visualize specific hippocampal regions, layers, and neuron types. The neuron type definitions and census data are curated based on the mouse hippocampal neuron classifications available from Hippocampome.org . This ensures that the anatomical structure and cell-type representation in the demo circuits reflect up-to-date experimental knowledge from peer-reviewed literature.
The distribution of glutamatergic (excitatory) and GABAergic (inhibitory) neurons of distinct types across each subregion and layer of the hippocampal formation is incorporated, based on Hippocampome.org data. This organization allows users to accurately explore the spatial arrangement of excitatory and inhibitory populations within different anatomical areas such as the Dentate Gyrus (DG), CA3, CA2, CA1, Subiculum, and Entorhinal Cortex (EC).
The workflow includes the following steps:
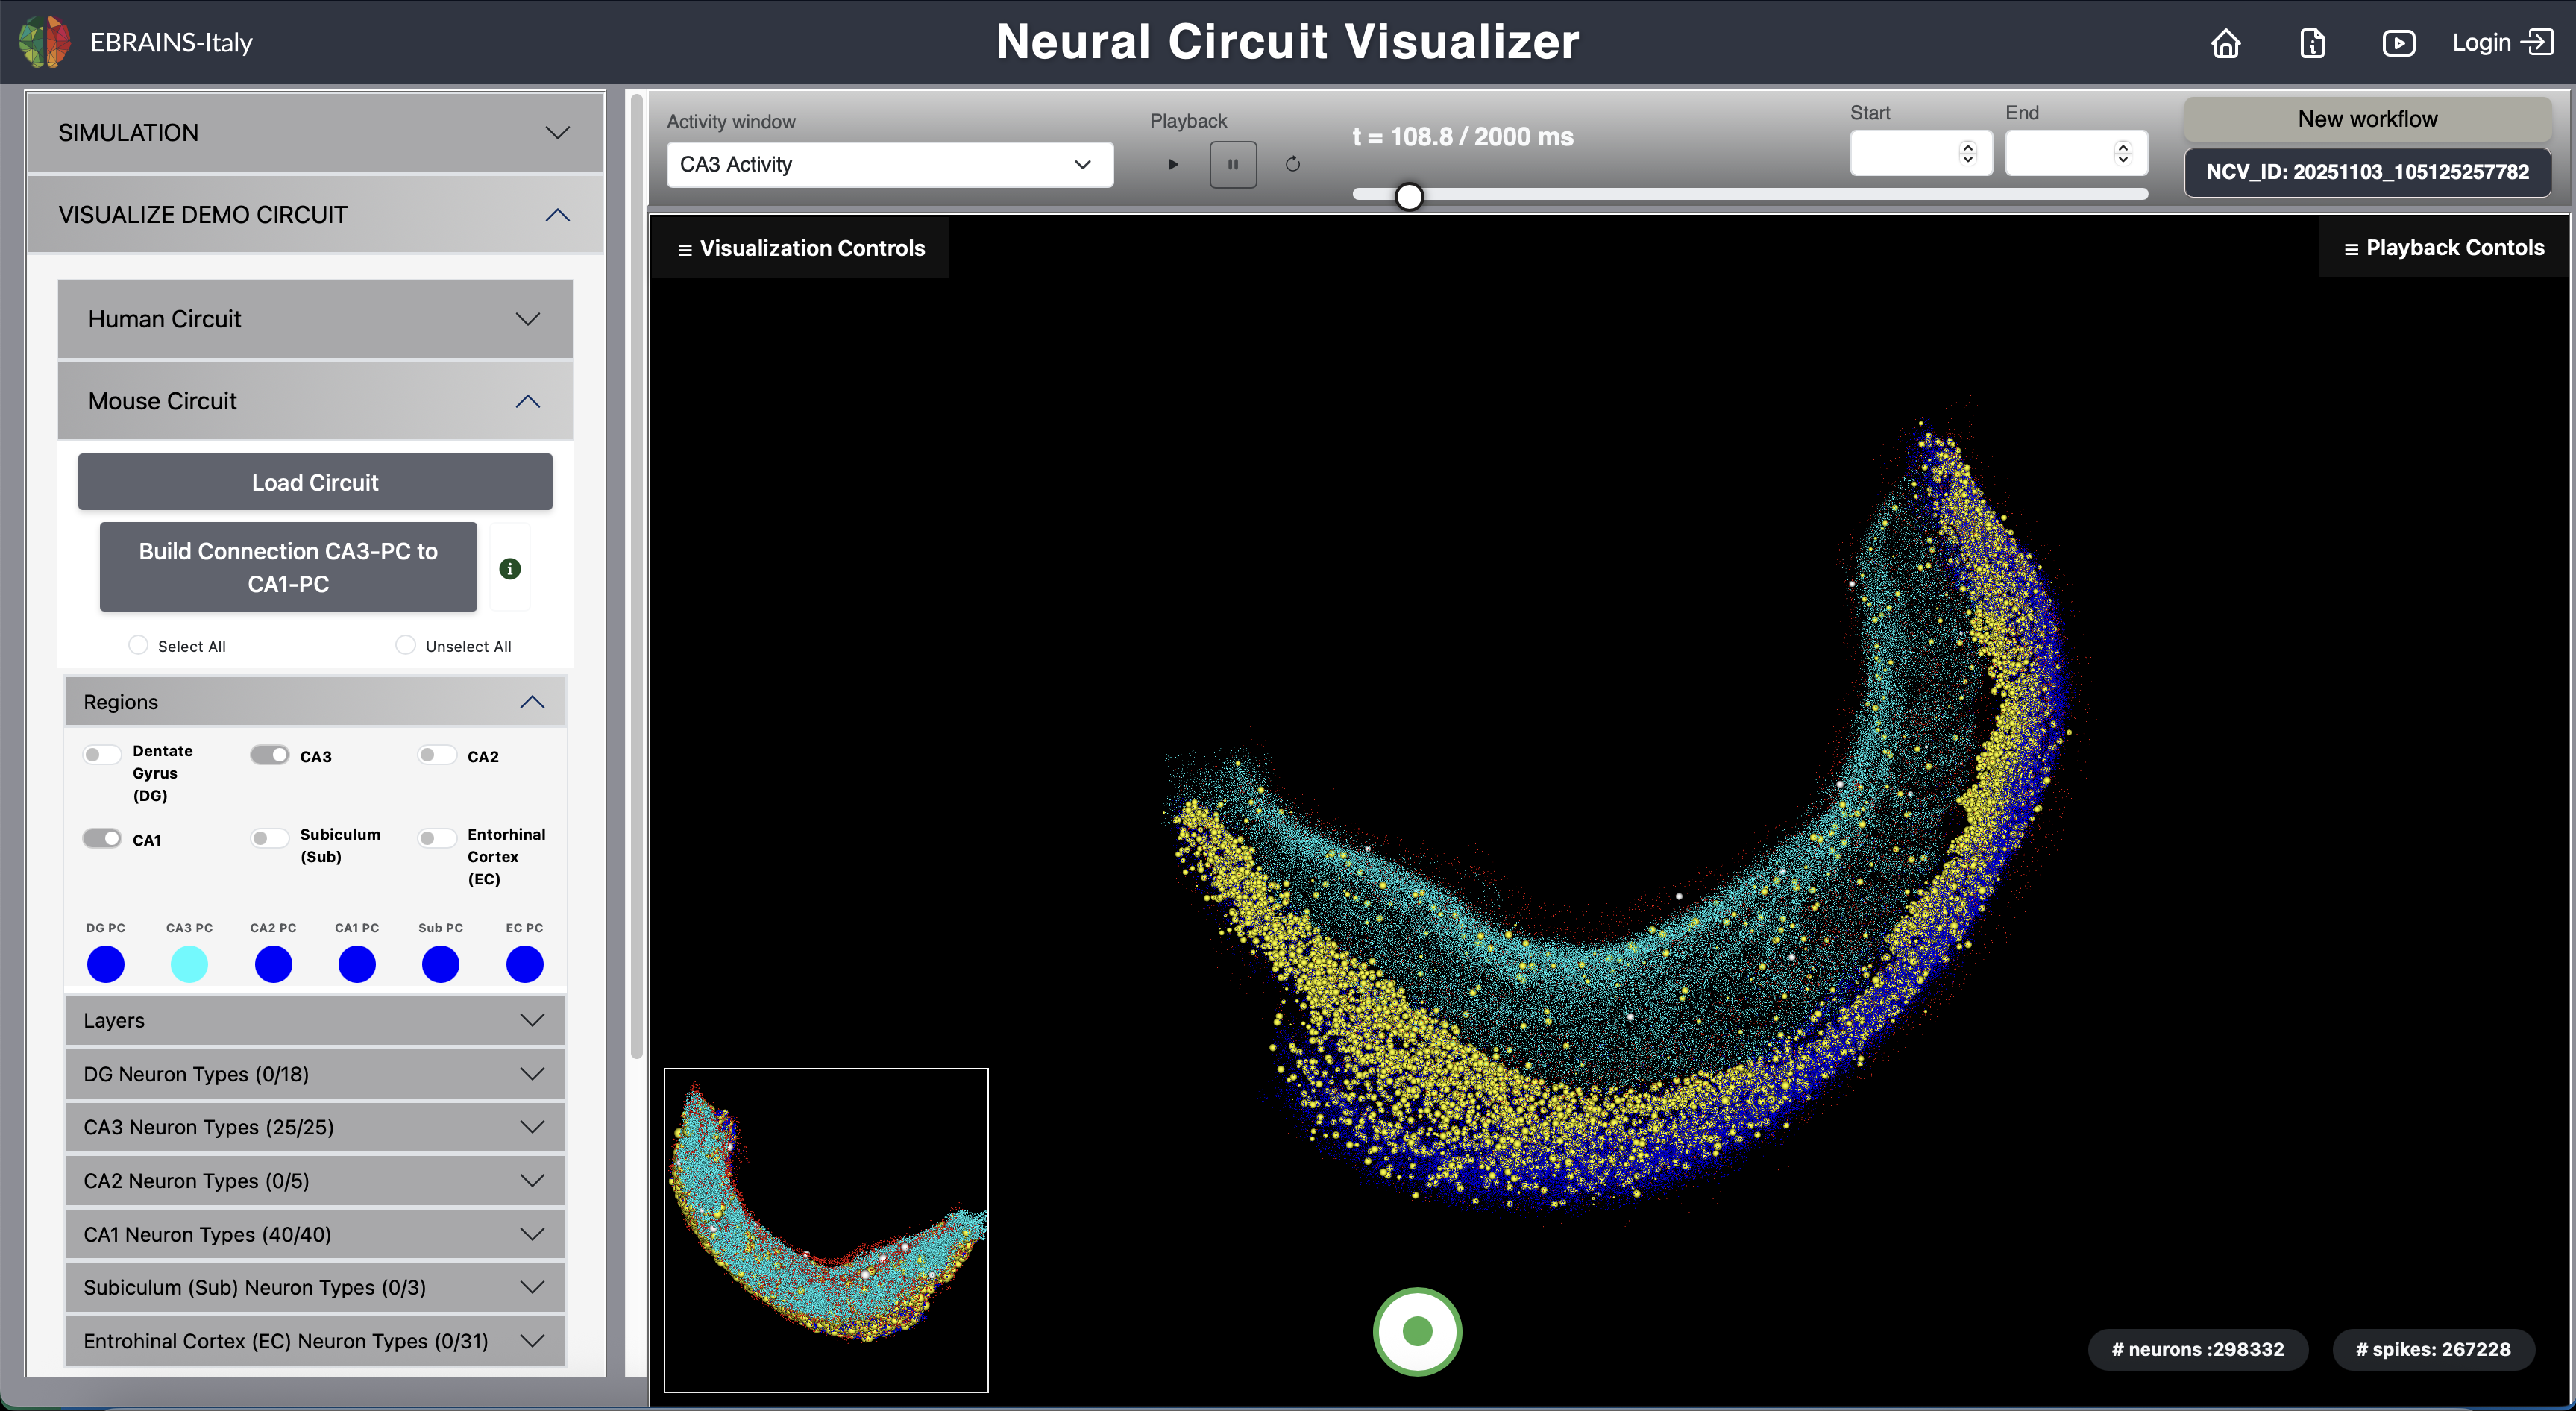
Fig. 8 Mouse Circuit (CA3 to CA1 Projection).
Video 1: How to explore the mouse demo circuit via the NCV
Video 2: How to submit a job on the HPC, fetch and visualize the results
.csv
files for network and activity, respectively.
.hdf5
file containing both network and activity.
.h5
files for network and activity along with a corresponding
.csv
file for neuron type definitions.
CSV Format (2 Files Required)
Network file (.csv)
Gid, X, Y, Z
Activity file (.csv)
Gid, Time
HDF5 Format
Single HDF5 file containing both datasets
/network → (Gid, X, Y, Z)
/activity → (Gid, Time)
SONATA Format
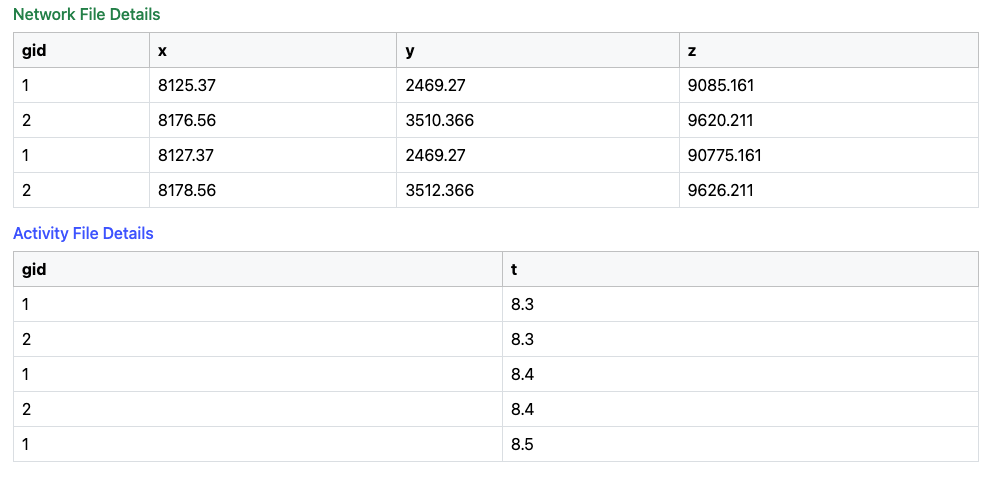
Fig. 9 Network and Activity Data Structure.
The following files allow a 2D visualization of 1M neurons
.csv
,
.hdf5
or
SONATA files
to upload

Fig. 10 Uploading files.
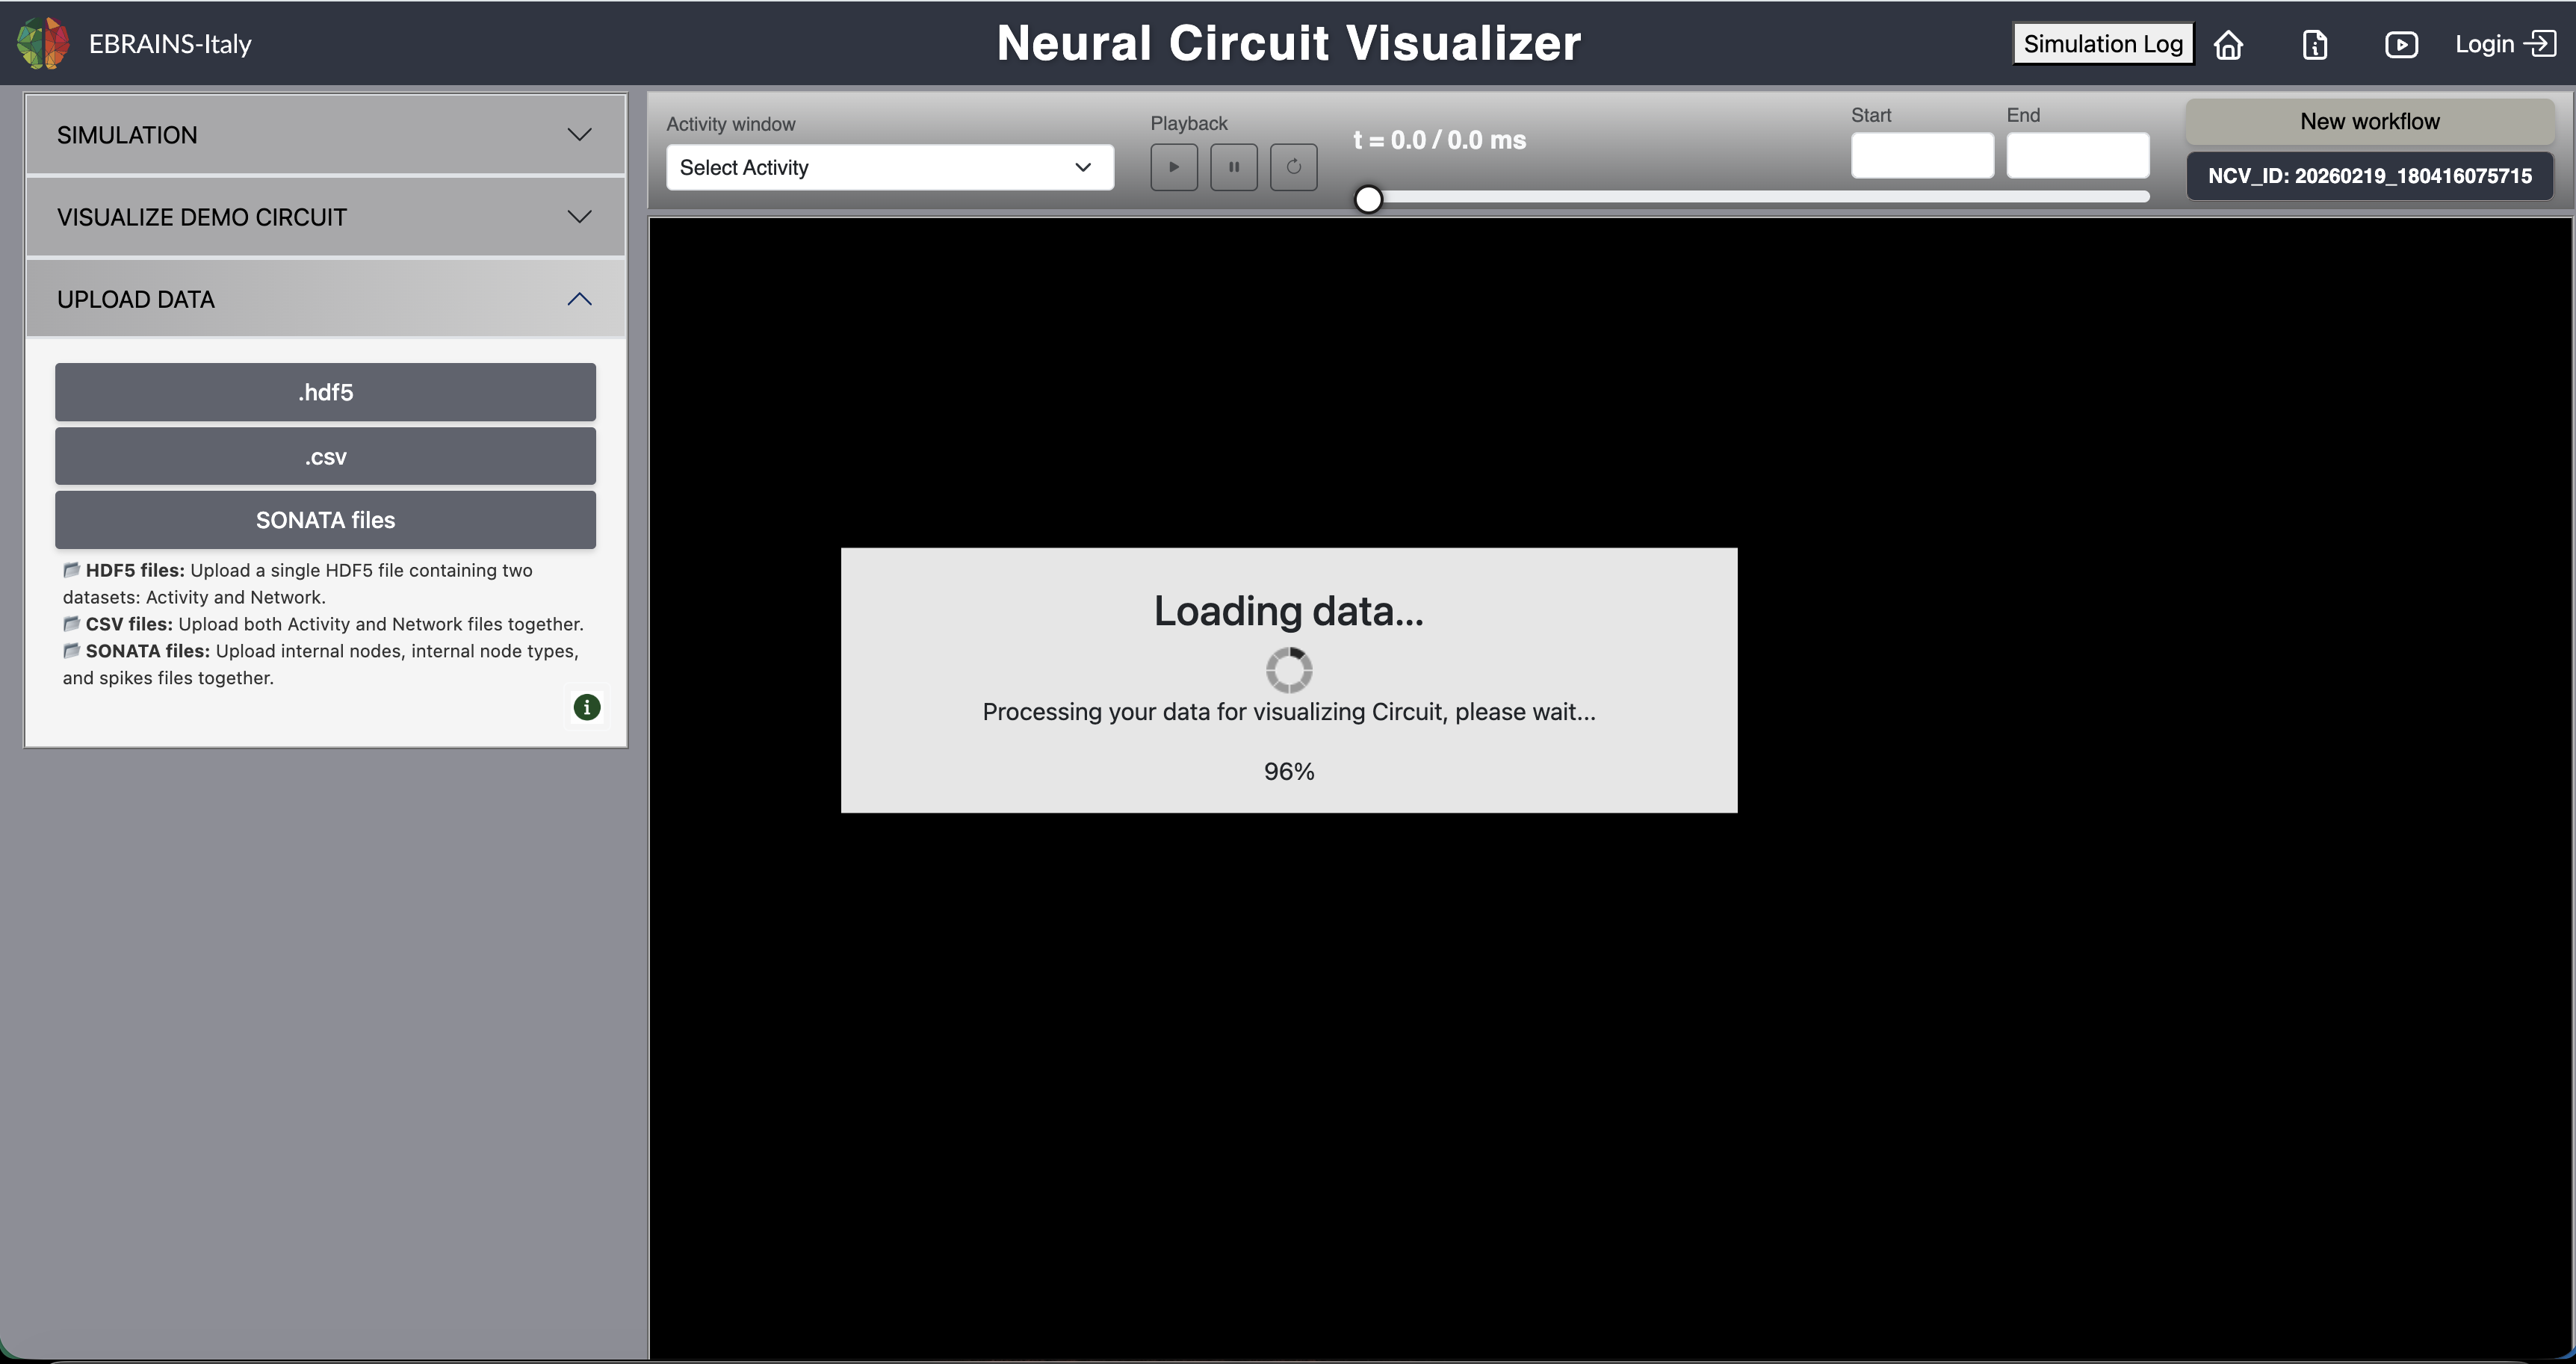
Fig. 11 Loading data for visualizing circuit.
For any issues, please do not hesitate to contact us at: ali.maqsood AT ibf.cnr.it